WeBWorK Questions for Introduction to Statistics
What is WeBWorK?
From http://webwork.maa.org/:
WeBWorK is an open-source online homework system for math and sciences courses. WeBWorK is supported by the MAA and the NSF and comes with a National Problem Library (NPL) of over 30,000 homework problems. Problems in the NPL target most lower division undergraduate math courses and some advanced courses. Supported courses include college algebra, discrete mathematics, probability and statistics, single and multivariable calculus, differential equations, linear algebra and complex analysis.
I have written a set of questions to be used with the WeBWorK online homework system for an undergraduate Introduction to Statistics course. Students get instant feedback on their work, and I have the option of offering multiple attempts on homework assignments. All of the questions except the one on discrete probability distributions use randomly generated data sets and constants, so all students have different variations on a similar problem. Have a look at the question descriptions and screen shots below, and feel free to use them in your course.
If you are a math instructor at NCC, you can get a WeBWorK account by sending an email to Steve Ochani from your NCC email account, indicating the name of the course and section you want displayed in the course listing. Have a look at online documentation at http://webwork.maa.org/documentation.html for information on how to get started using the system.
All questions below are in the form of WeBWorK ".pg" files. To use them, create a new homework set in WeBWorK, add a blank problem template to the end of the homework set, and copy and paste the contents of the .pg file into the problem editor.
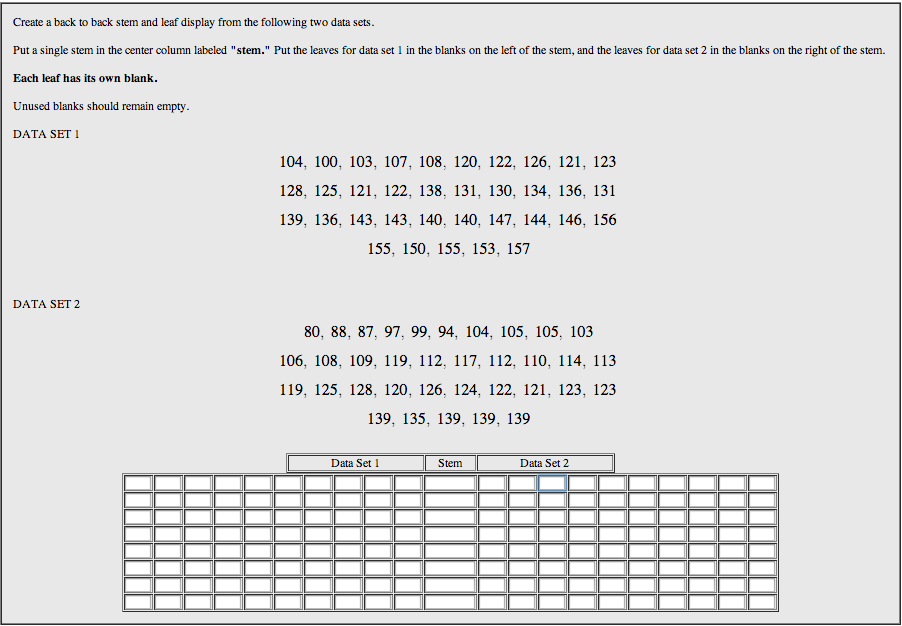
Stem and Leaf Display
Description: A WeBWorK problem that asks students to construct a back to back stem and leaf display. Data sets are randomly generated so each student has a unique problem.
Click the image to enlarge the screen shot.
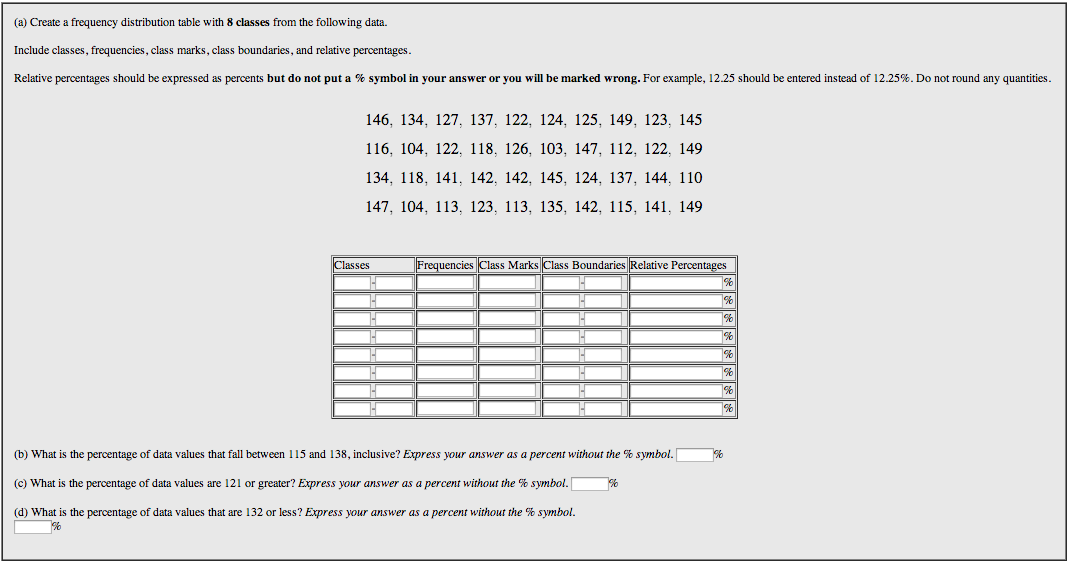
Frequency Distribution Table
Description: A WeBWorK problem that asks students to construct a frequency distribution table and answer questions on it. The data set is randomly generated so each student has a unique problem.
Click the image to enlarge the screen shot.
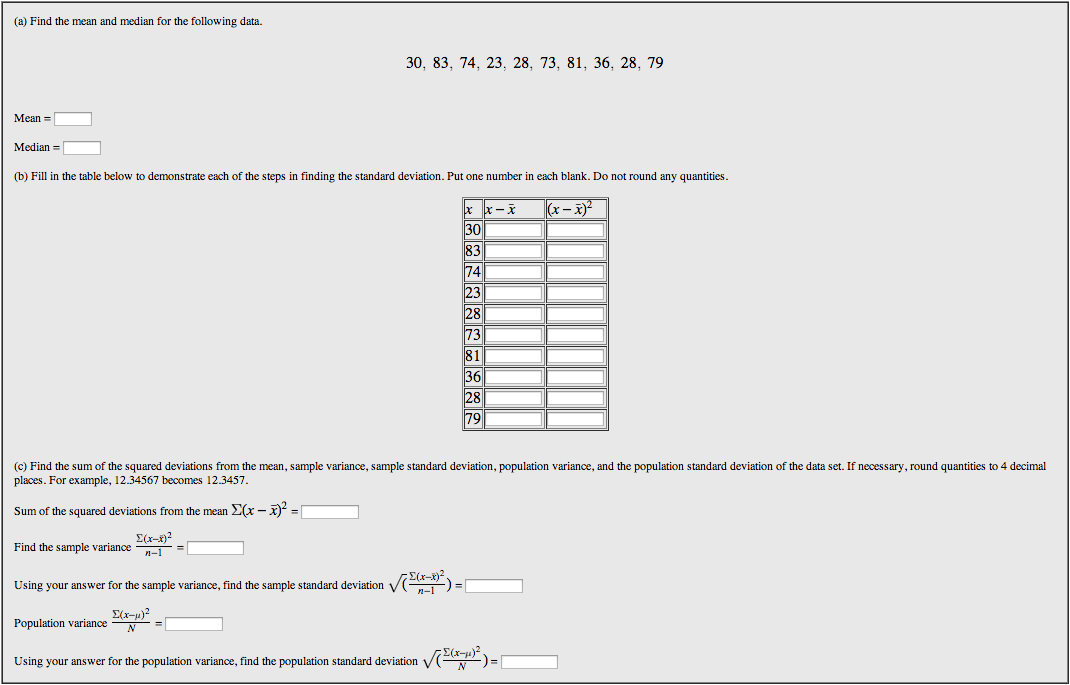
Standard Deviation
Description: A WeBWorK problem that asks students to calculate the sample and population variance and standard deviation for a data set. The data set is randomly generated so each student has a unique problem.
Click the image to enlarge the screen shot.
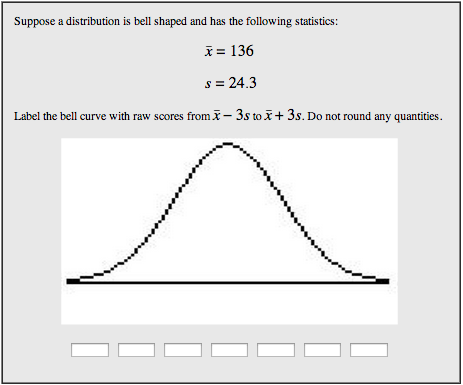
Label a Bell Curve
Description: A WeBWorK problem that asks students to label raw scores +/- 3 standard deviations from the mean of a bell-shaped distribution. The mean and standard deviation are randomly generated so each student has a unique problem.
Click the image to enlarge the screen shot.
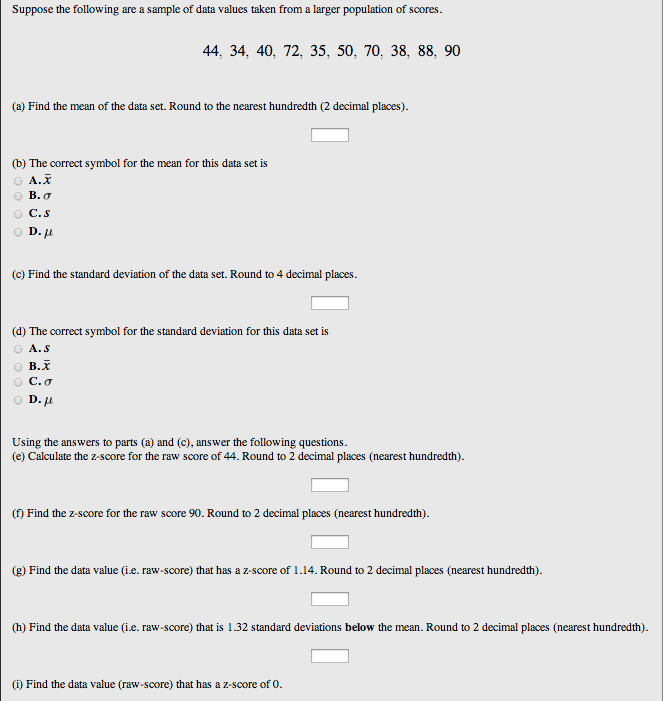
Converting Raw Scores to Z-Scores and Z-Scores to Raw Scores
Description: A WeBWorK problem that asks students to find the mean and standard deviation of a data set, and convert raw scores to z-scores and z-scores to raw scores. The data set is randomly generated so each student has a unique problem.
Click the image to enlarge the screen shot.
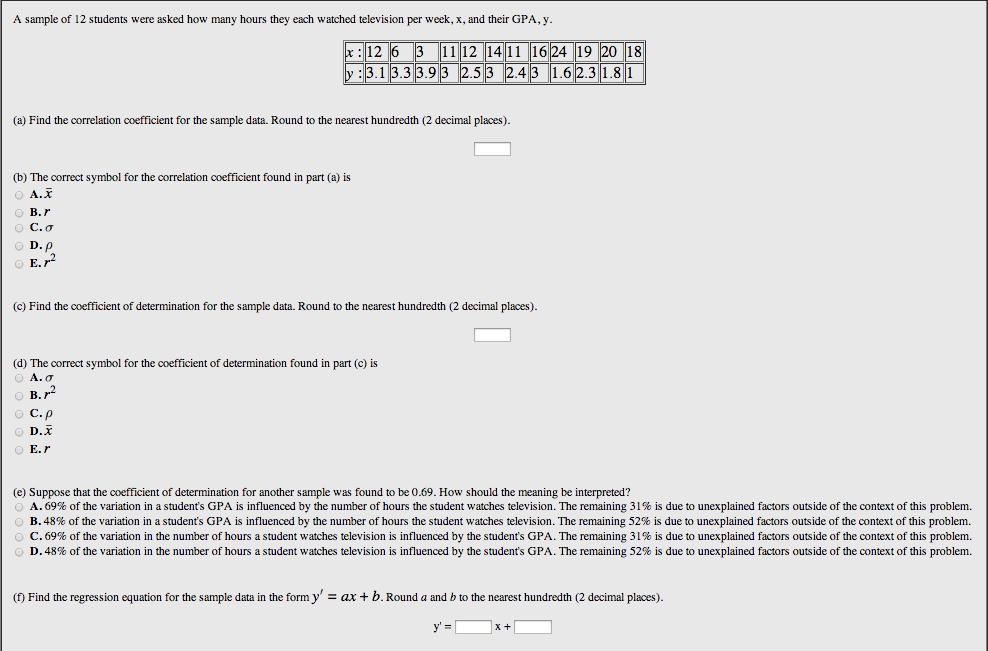
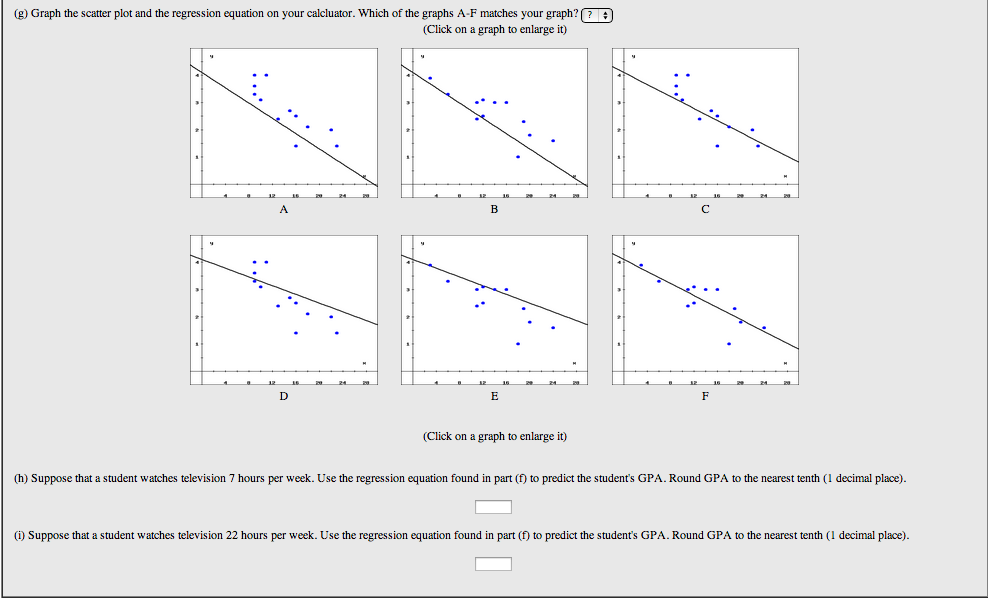
Linear Correlation and Regression Analysis
Description: A WeBWorK problem that asks questions about the correlation between two sets of data values. The data sets are randomly generated so each student has a unique problem.
Click the images to enlarge the screen shots.
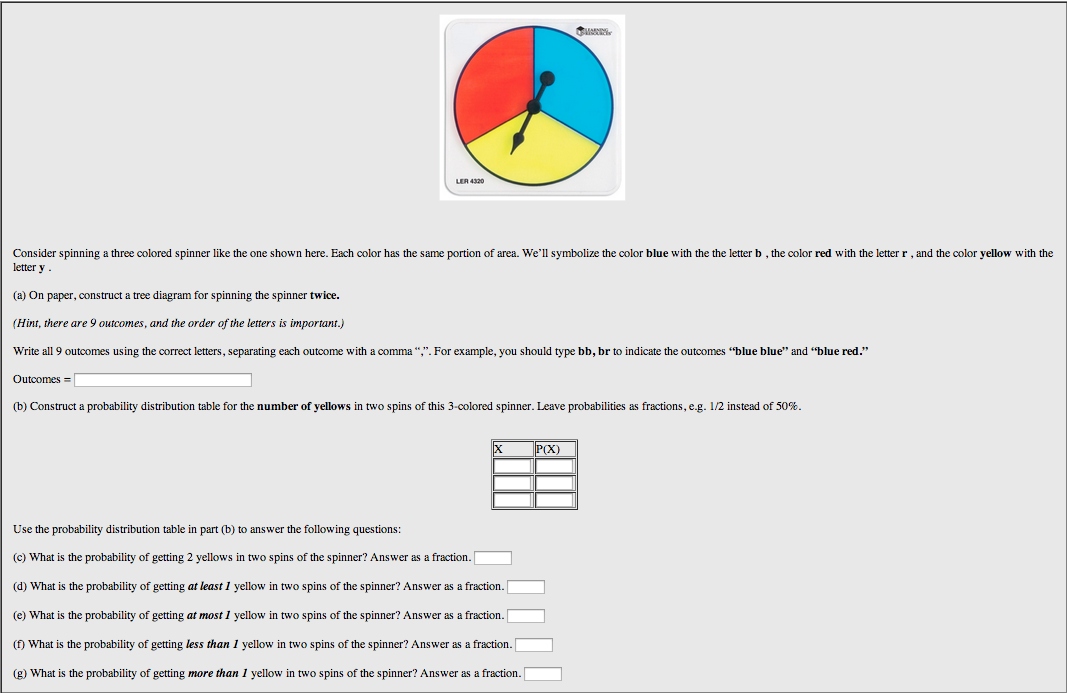
Discrete Probability Distributions
Description: A WeBWorK problem that asks students construct a probability distribution and answer questions on it.
Click the image to enlarge the screen shot.
Binomial Probability
Description: A WeBWorK problem that asks students to calculate binomial probabilities. The values for n, p, and s are randomly generated so each student has a unique problem.
Click the image to enlarge the screen shot.

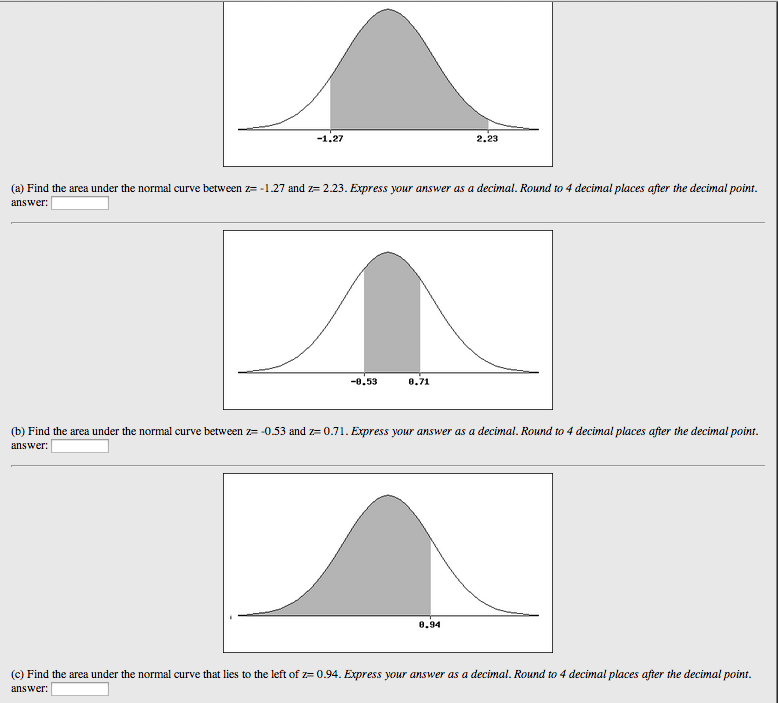
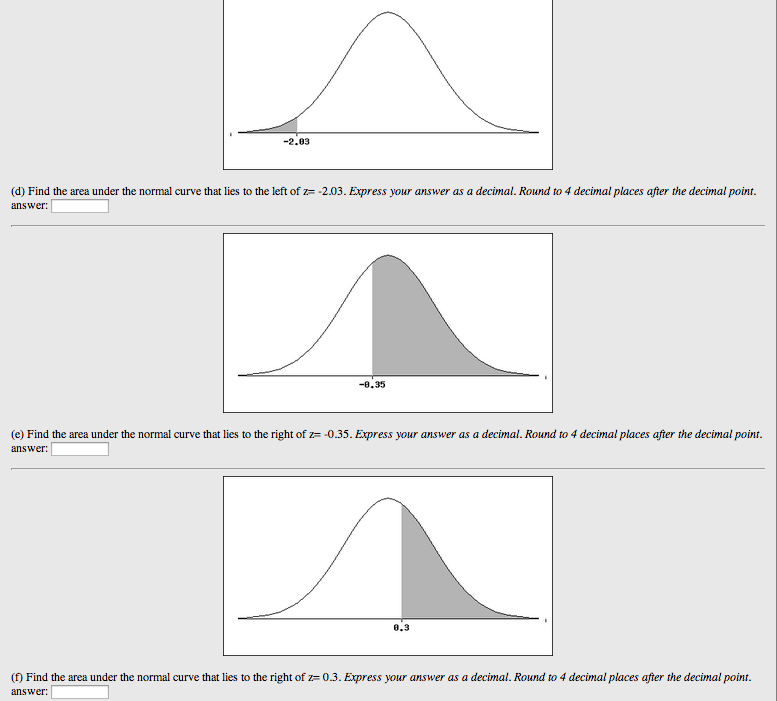
Area Under the Normal Curve Given Z-Scores
Description: A WeBWorK problem that asks students to find the area under the normal curve based on given z-scores. Answers are expected to be the same as a student would get using the normalcdf function on the TI calculator. Z-scores are randomly generated so each student has a unique problem.
Click the images to enlarge the screen shots.
Finding Z-Scores Given Area
Description: A WeBWorK problem that asks students to find z-scores given the area under the normal curve. Answers are expected to be the same as the student would get using the invnorm function on the TI calculator. Areas are randomly generated so each student has a unique problem.
Click the image to enlarge the screen shot.

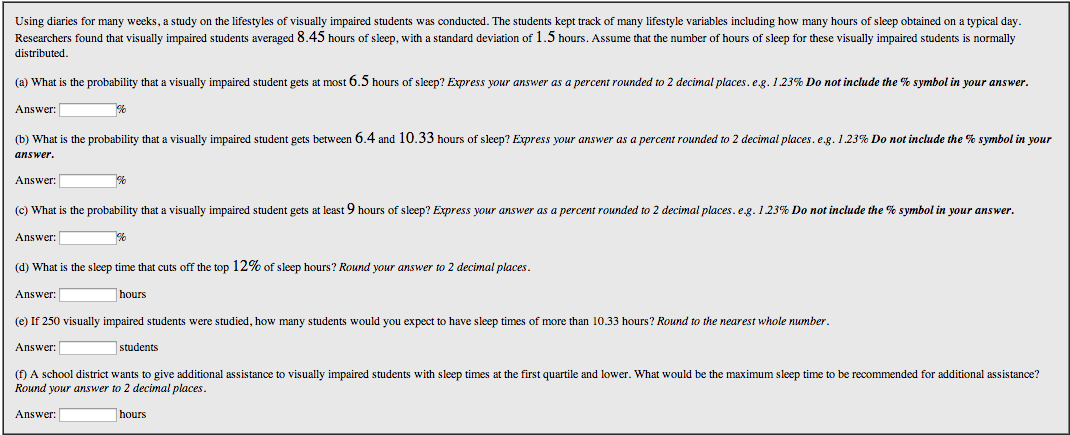
Continuous Probability
Description: A WeBWorK problem that asks students to find continuous probabilities based on the normal distribution. Answers are expected to be the same as the student would get using the normalcdf function on the TI calculator. The mean, standard deviation, and other constants are randomly generated so each student has a unique problem.
Click the image to enlarge the screen shot.
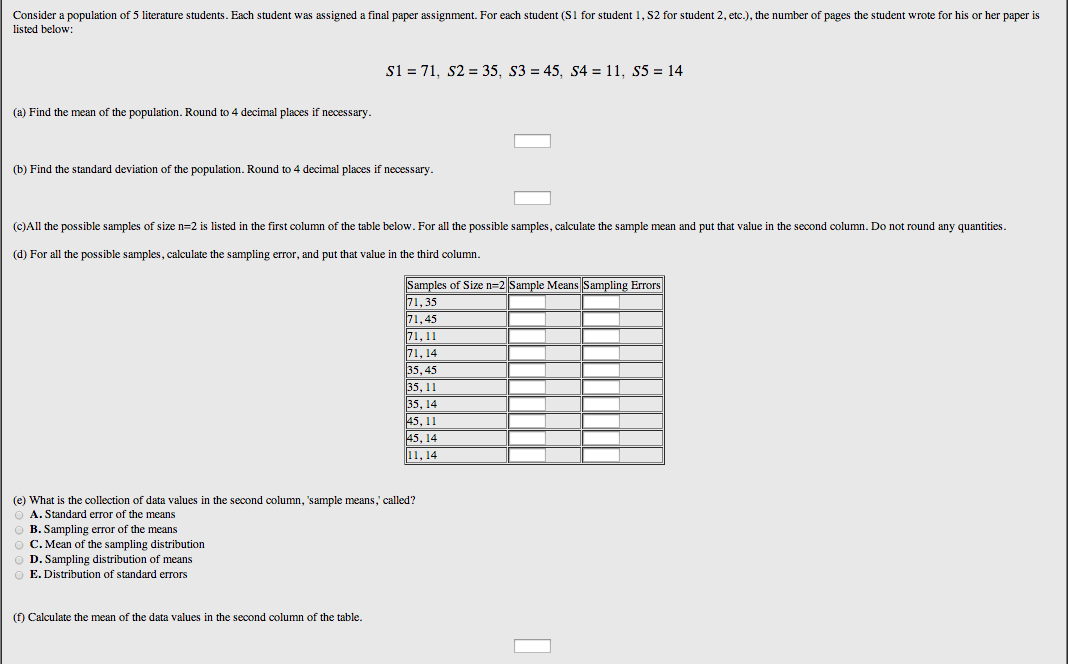
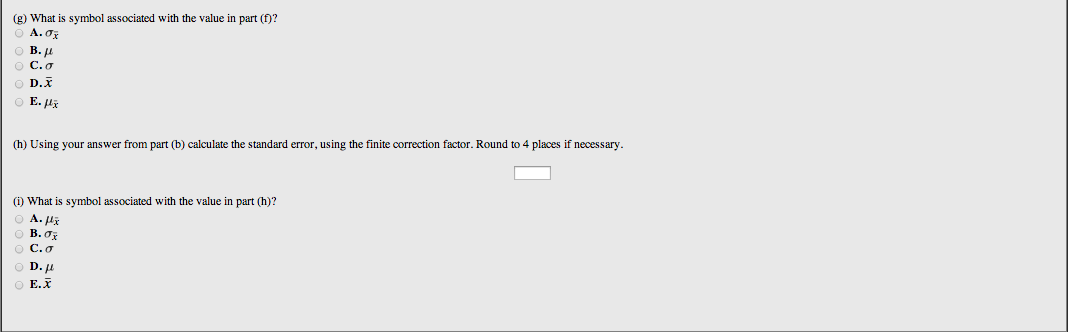
Sampling Distribution
Description: A WeBWorK problem that asks students to build a sampling distribution based on a small population, answer questions on it, and calculate the standard error using the finite correction factor. The data set is randomly generated so each student has a unique problem.
Click the images to enlarge the screen shots.
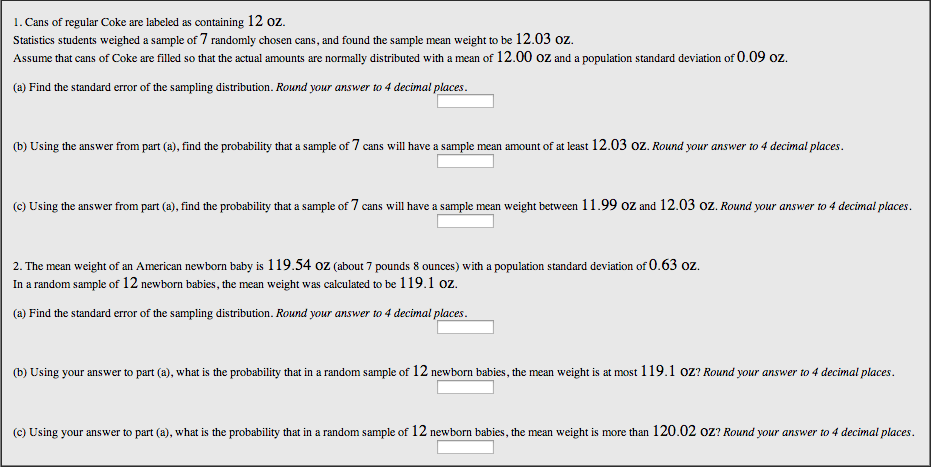
Probability for Sampling Distributions
Description: A WeBWorK problem that asks students to answer probability questions based on a sampling distribution. Answers are expected to be the same as the student would get using the normalcdf function on the TI calculator. The mean, standard deviation, sample size, and other constants are randomly generated so each student has a unique problem.
Click the image to enlarge the screen shot.
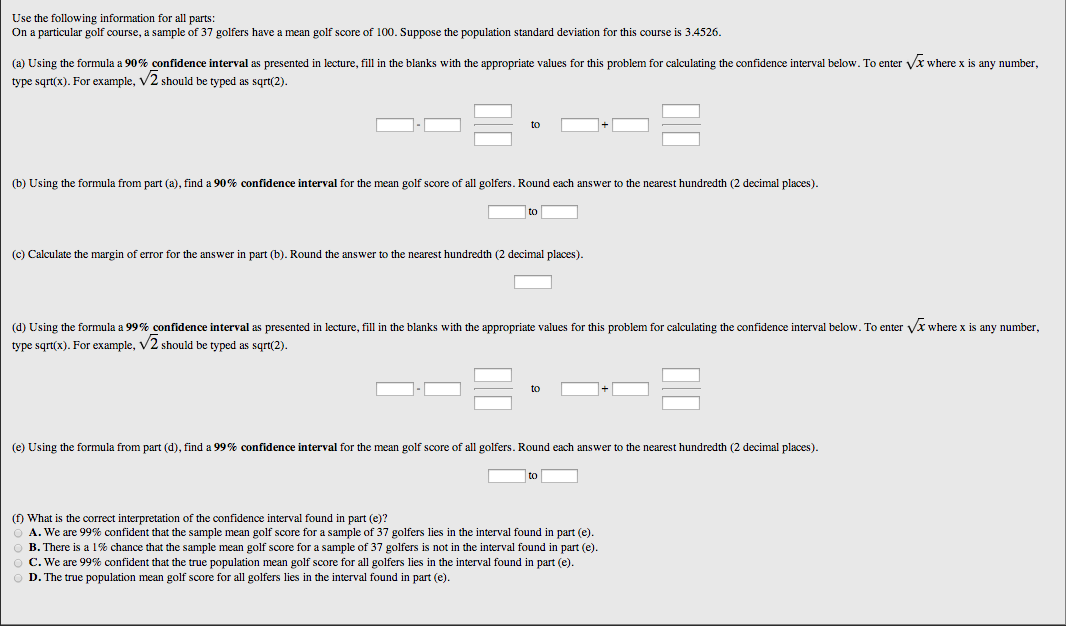
Confidence Interval Given a Population Standard Deviation
Description: A WeBWorK problem that asks students to construct a confidence interval given a population standard deviation and answer questions on it. The mean, standard deviation, and sample size are randomly generated so each student has a unique problem.
Click the image to enlarge the screen shot.
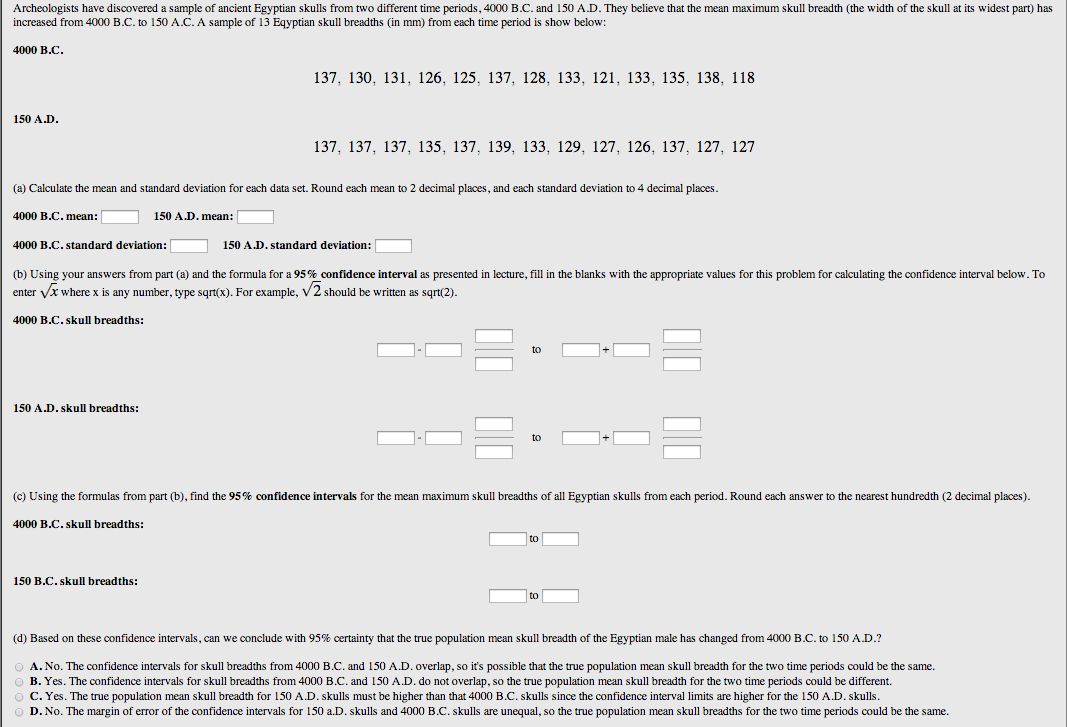
Confidence Interval with an Unknown Population Standard Deviation
Description: A WeBWorK problem that asks students to construct confidence intervals from raw data sets and answer questions on them. The data sets are randomly generated so each student has a unique problem.
Click the image to enlarge the screen shot.
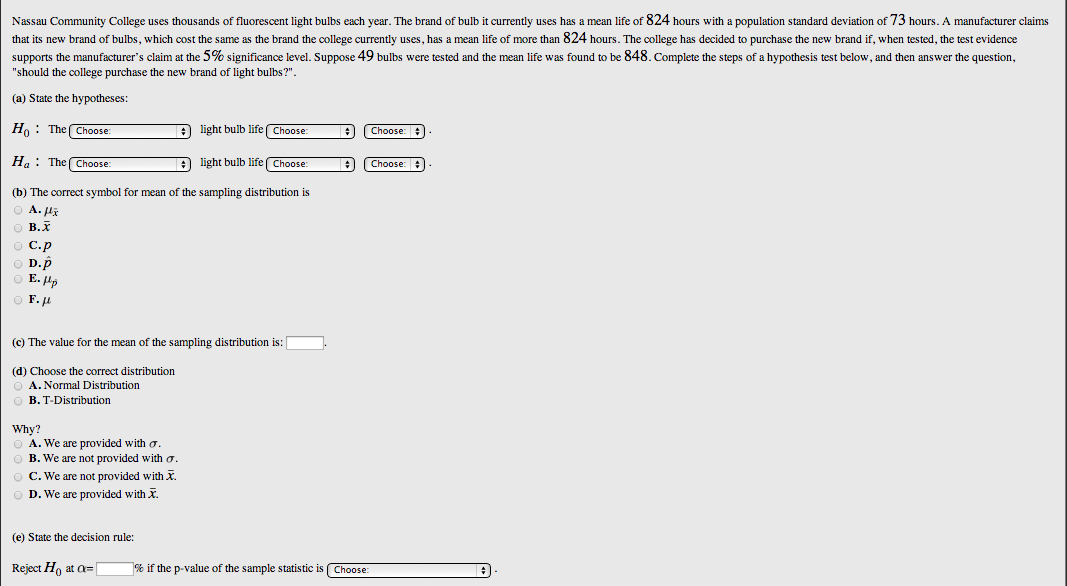
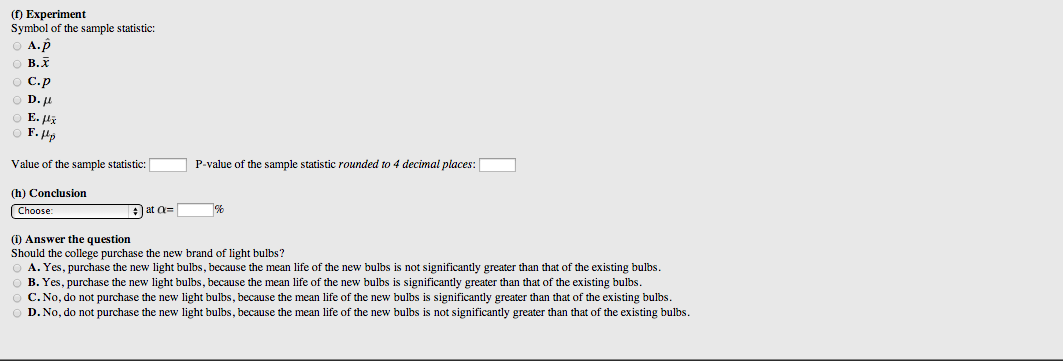
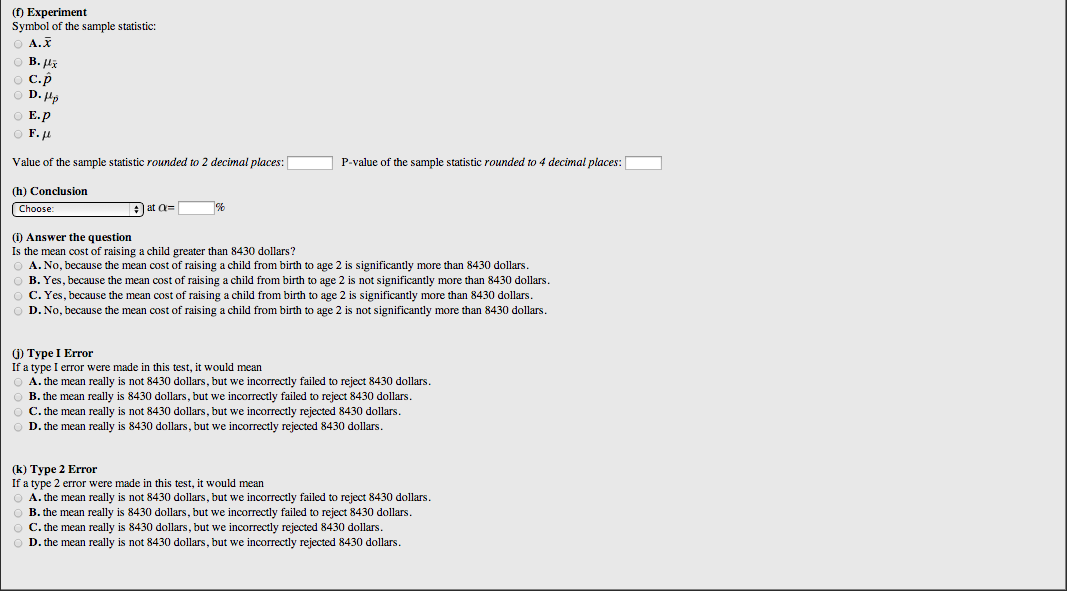
Hypothesis Test Given the Population Standard Deviation
Description: A WeBWorK problem that asks students to conduct a hypothesis test with a known population standard deviation. The p-value approach is used. The sample mean, population mean, standard deviation, and sample size are randomly generated so each student has a unique problem.
Click the images to enlarge the screen shots.
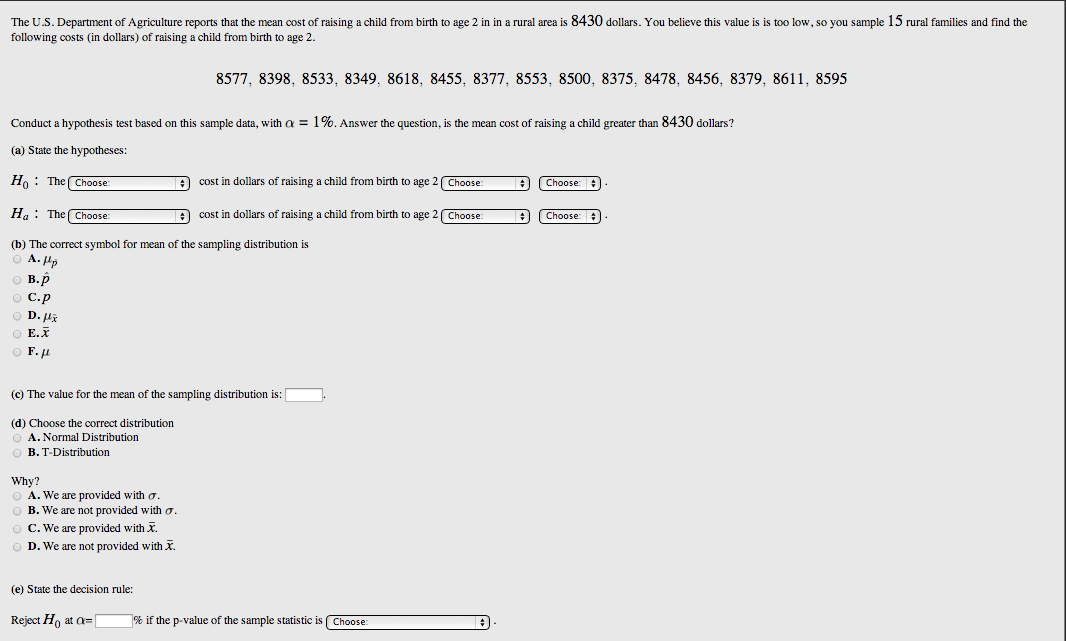
Hypothesis Test Given a Raw Data Set and Unknown Population Standard Deviation
Description: A WeBWorK problem that asks students to conduct a hypothesis test with a raw data set and unknown population standard deviation. The p-value approach is used. The population mean and data set are randomly generated so each student has a unique problem.
Click the images to enlarge the screen shots.
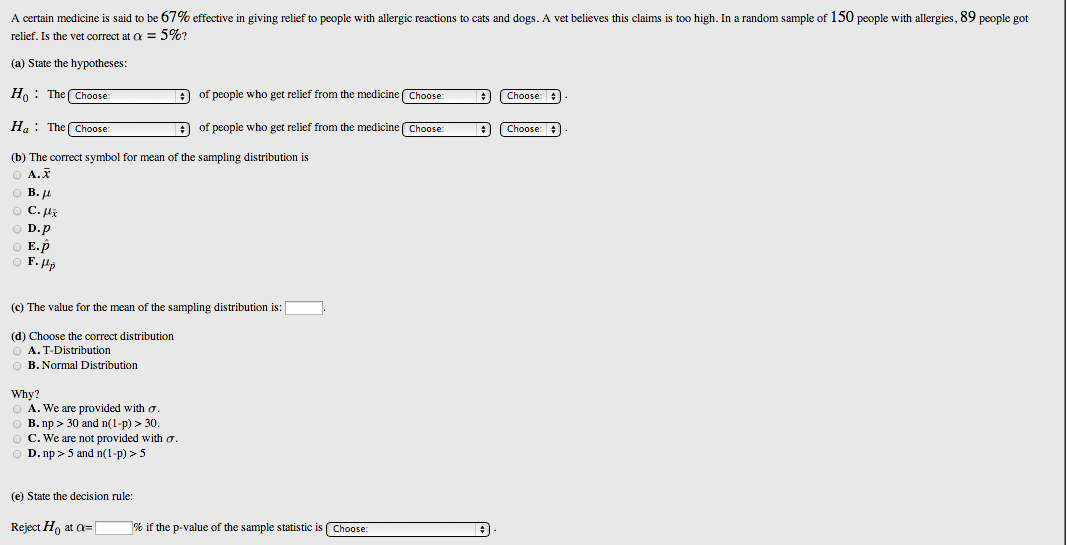
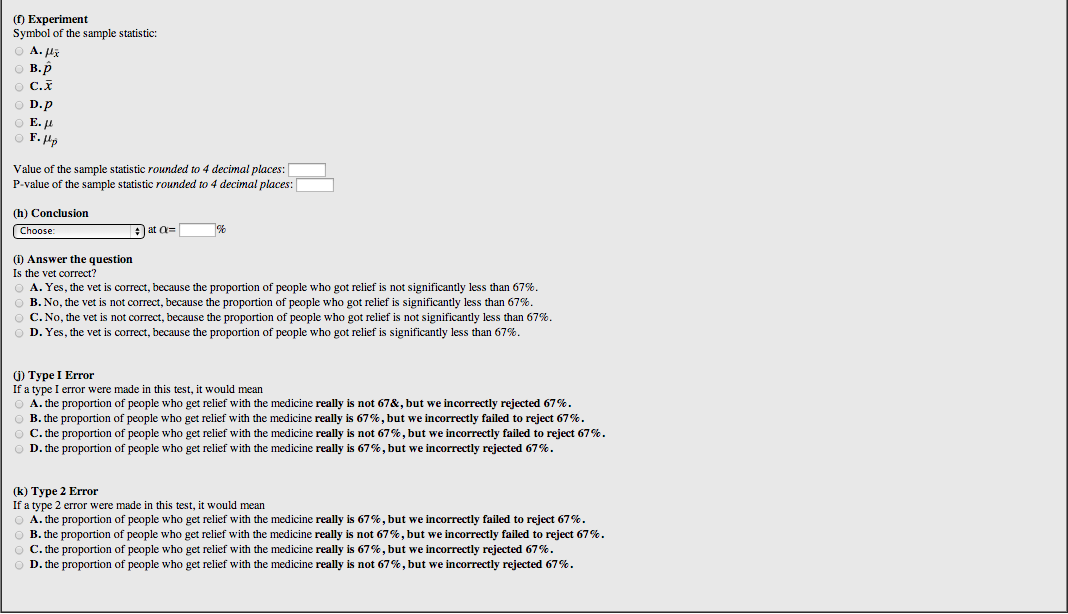
Hypothesis Test Involving Proportions
Description: A WeBWorK problem that asks students to conduct a hypothesis test involving proportions. The p-value approach is used. The population proportion, sample proportion and sample size are randomly generated so each student has a unique problem.
Click the images to enlarge the screen shots.
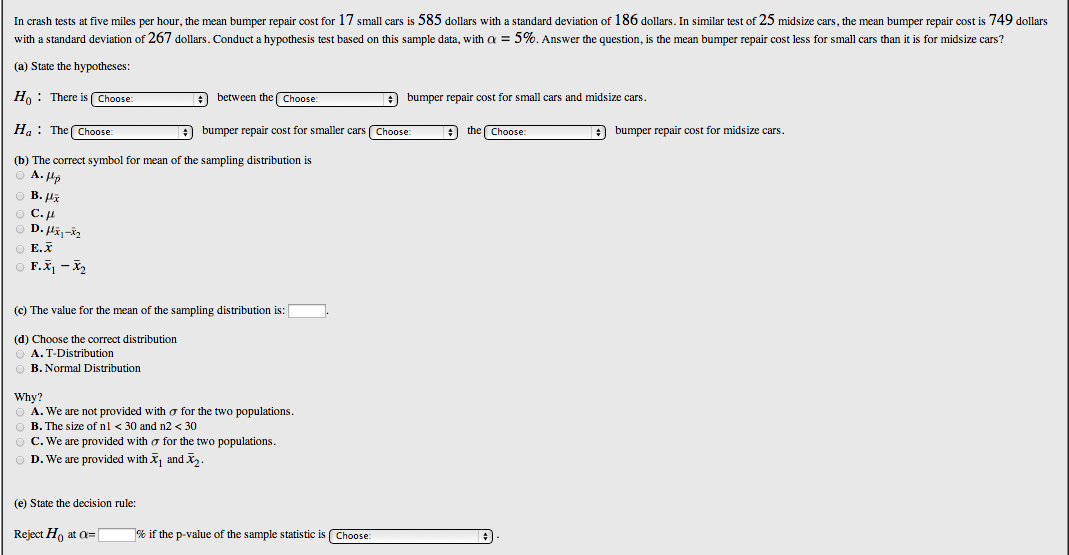
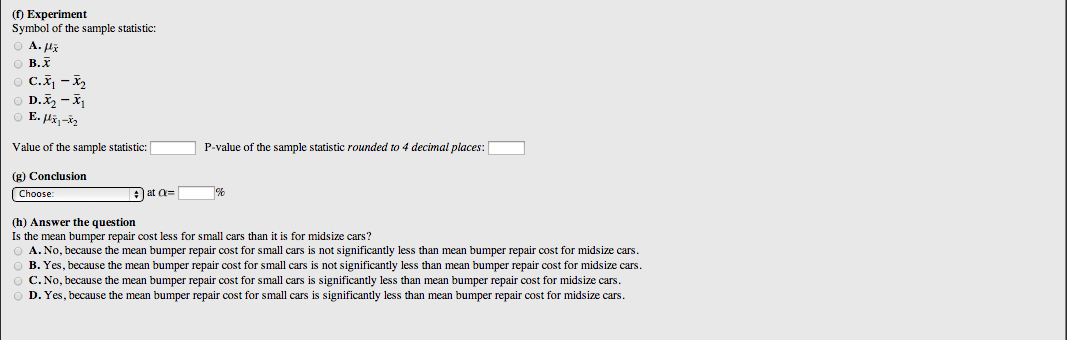
Hypothesis Test Given Two Sample Means
Description: A WeBWorK problem that asks students to conduct a hypothesis test with two sample means and unknown population standard deviations. The p-value approach is used. The sample means, standard deviations, and sample sizes for the two samples are randomly generated so each student has a unique problem.
Click the images to enlarge the screen shots.
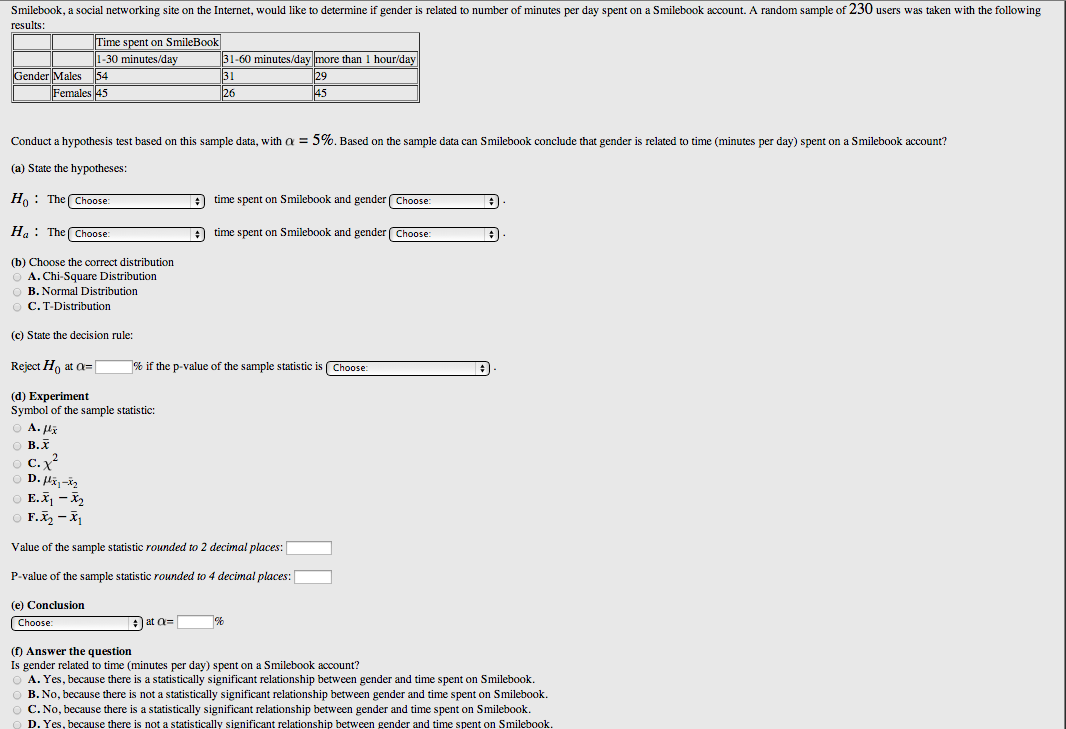
Chi Square Test for Independence
Description: A WeBWorK problem that asks students to conduct a chi square hypothesis test for independence. The p-value approach is used. The observed frequencies and sample size are randomly generated so each student has a unique problem.
Click the image to enlarge the screen shot.